Featured post
- Get link
- X
- Other Apps
BECOME AN EXCEL EXPERT IN A MINUTE
Are you tired of watching online Excel tutorials?
I have been working on Excel for more than 11 years and trust me I have seen the most weirdest and alien situations with this tool and learned quite a stuff that is worth sharing. This is the only reason why I thought it's worth this post for you guys so you don't have to go through such a long journey to be a pro in Excel database handling or presentation.
If you are just like me who always wondered how to grab an interesting opportunity by showcasing some Excel skills and making your resume look impressive then, today is the last day of your wondering as your search ends here only.
Where to begin?
No matter how many YouTube videos you watch and how many articles you read, you always end up trying to memorize formulas and functionalities that are hard to remember, and most of them you forget the next day and then "Back to Square One". So what is the solution?
A blind memorizing technique is not a cup of tea for most people like us. Yes, many individuals are ridiculously sharp and amazing at memorizing even plain things without practice and practical knowledge. But what about most of the people who are not good at it. People who require some level of practice, practical experiments, and multiple attempts to finally get it in their brains.
Step #1
Analyze the Problem
First thing first, you need to analyze what exactly are you looking for and what type of result is expected from any given dataset available. There can be multiple sources with variations in formats and information but there has to be one purpose. That purpose is the key to starting your journey to get it done. These problems are initially summarised under two basic categories.
Category #1
You are given two sets of data one is a report that shows employees' internal details i.e. their designation, email, and status, and the other report shows details about their external portal access. You are given a situation where you have to report how many of our company employees have access to that external portal.
Category #2
You have one large data set from one system source and you have to modify it to extract some easy-to-understand details by summarizing the data with situation-based operations.
Step #2
Understand the Expectations?
Now that you know the problem, you have to ask what do you want to show exactly? Here the scope is limitless and goes to infinity as there can be multiple scenarios. For example:
Example#1
From the "Category#1" example, there can be a requirement to show how many active company users have access to the external platform or
Example#2
How many terminated company users still have access to that external platform. etc.
Step #3
Hit the Floor
A Master Trick
#1 Find the BOSS
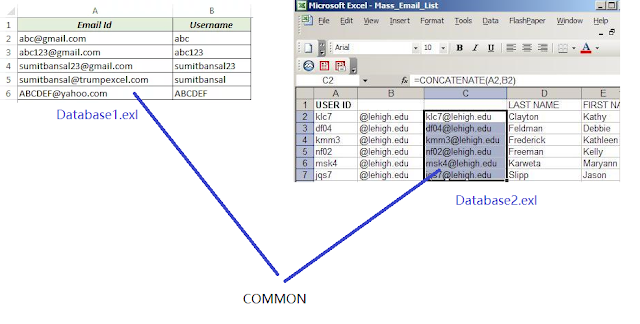
No matter if you have Category#1 or 2 from Step#1 (Above) you always have to find the main range which should be either the main highlight of the data (i.e. users' names) for the Category#1 situation or you will have to identify the range which is common between two datasets (Category#2) i.e. users' email addresses which are common under both or multiple data sets.
#2 Make a Bridge
(For multiple sheets/files)
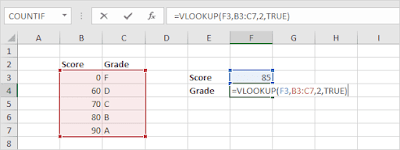
Now that you know the boss data, it's time to identify the type of link you have to apply to the available data sets by tools i.e. vlookup, lookups, "IF" formulas, etc. Remember, you will have to make sure that the lookup/checking data format is the same on both sides i.e. text for text and the number is number on your both files/sheets.
#3 Decorate
CONCLUSION
IF YOU LOSE IT, YOU LOSE IT
QUESTION???
Comments


Teaches how to navigate Excel perfectly without using the mouse, it is a challenge…..23
ReplyDeleteExcel is very large if we have to explain short keys and short functions to perform basic tasks. Here I focused on something which no one really talks about. You can find a billion shortcuts and keys, and functions online. Here I can specifically address any challenge you mention in the simplest way.
Delete